Call +(254) 703 030 000 / 751 483 999 / 721 704 777
.....Read More

Frequently Asked Questions
What are the benefits of using data recording equipment?
Data recording equipment offers numerous benefits across various fields and applications:
1. **Accuracy and Precision**: These devices ensure high levels of accuracy and precision in data collection, minimizing human error and enhancing the reliability of the data.
2. **Efficiency**: Automated data recording saves time and resources by quickly capturing large volumes of data, allowing personnel to focus on analysis rather than collection.
3. **Consistency**: Data recording equipment provides consistent data capture, ensuring uniformity in data collection processes, which is crucial for longitudinal studies and comparisons.
4. **Real-time Monitoring**: Many devices offer real-time data monitoring, enabling immediate analysis and decision-making, which is vital in dynamic environments like manufacturing or healthcare.
5. **Data Storage and Management**: These devices often come with integrated storage solutions, facilitating easy data management, retrieval, and backup, which is essential for maintaining data integrity over time.
6. **Enhanced Analysis**: With precise and comprehensive data, more sophisticated and accurate analyses can be performed, leading to better insights and informed decision-making.
7. **Scalability**: Data recording equipment can be scaled to accommodate growing data needs, making it suitable for both small-scale and large-scale operations.
8. **Integration**: Many modern data recording systems can integrate with other technologies and software, enhancing their functionality and allowing for seamless data flow across systems.
9. **Compliance and Reporting**: Automated data recording helps in maintaining compliance with industry standards and regulations by providing accurate and verifiable records, which are essential for audits and reporting.
10. **Cost-effectiveness**: Over time, the investment in data recording equipment can lead to cost savings by reducing labor costs, minimizing errors, and improving operational efficiency.
Overall, data recording equipment is a critical tool for enhancing data quality, operational efficiency, and decision-making across various sectors.
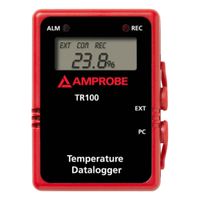
How do nonelectrical properties data loggers work?
Nonelectrical properties data loggers are devices designed to measure and record physical parameters that do not involve electrical signals. These parameters can include temperature, humidity, pressure, light intensity, and more. The operation of these data loggers involves several key components and processes:
1. **Sensors**: At the core of a nonelectrical data logger are sensors that detect specific physical properties. For example, thermocouples or thermistors are used for temperature, hygrometers for humidity, and barometers for pressure. These sensors convert the physical property into a measurable signal, often a voltage or resistance change.
2. **Signal Conditioning**: The raw signal from the sensor is often weak or noisy. Signal conditioning circuits amplify, filter, and convert these signals into a form suitable for further processing. This step ensures accuracy and reliability in the data collected.
3. **Analog-to-Digital Conversion (ADC)**: The conditioned analog signal is then converted into a digital format using an ADC. This conversion is crucial for digital storage and processing, allowing the data logger to handle the information efficiently.
4. **Microcontroller/Processor**: A microcontroller processes the digital data, applying any necessary calculations or calibrations. It also manages data storage, user interface, and communication functions.
5. **Data Storage**: The processed data is stored in onboard memory, which can be non-volatile to prevent data loss during power failures. Storage capacity varies, allowing for different logging durations and frequencies.
6. **Power Supply**: Data loggers are typically powered by batteries, making them portable and suitable for remote or field applications. Energy-efficient designs extend battery life.
7. **User Interface and Communication**: Data loggers often include interfaces for configuration and data retrieval, such as USB, Bluetooth, or wireless connections. Users can set logging intervals, thresholds, and download data for analysis.
These components work together to provide accurate, reliable measurements of nonelectrical properties, enabling monitoring and analysis in various applications.
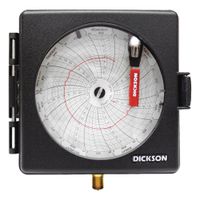
What is the difference between circular chart recorders and strip chart recorders?
Circular chart recorders and strip chart recorders are both devices used to record data over time, but they differ in format and application.
Circular chart recorders use a circular paper chart to record data. The chart is mounted on a rotating disc, and a pen or stylus marks data points on the chart as it rotates. The rotation can be set to complete a full circle over a specific time period, such as 24 hours or 7 days. This format is ideal for processes that repeat over a regular cycle, providing a quick visual reference for trends and patterns. Circular chart recorders are commonly used in applications like temperature and pressure monitoring in industrial settings.
Strip chart recorders, on the other hand, use a long strip of paper that moves linearly past a writing pen. The paper is typically stored on a roll and unwinds as data is recorded, allowing for continuous data logging over extended periods. This format is suitable for capturing data that does not necessarily repeat in a cycle and is useful for long-term monitoring. Strip chart recorders are often used in laboratory settings, research, and any application where detailed, continuous data logging is required.
In summary, the main differences lie in the format and application: circular chart recorders are best for cyclical data and provide a quick visual overview, while strip chart recorders are suited for continuous, detailed data logging over longer periods.
How do electrical properties data loggers store sensor readings?
Electrical properties data loggers store sensor readings by converting analog signals from sensors into digital data, which is then recorded and stored in memory. The process involves several key steps:
1. **Signal Acquisition**: Sensors measure electrical properties such as voltage, current, resistance, or capacitance. These measurements are typically analog signals.
2. **Analog-to-Digital Conversion (ADC)**: The analog signals are converted into digital form using an ADC. This conversion is necessary because digital data loggers can only process and store digital information. The ADC samples the analog signal at a specific rate, known as the sampling rate, and quantizes it into discrete digital values.
3. **Data Processing**: Once converted, the digital data may undergo processing to filter noise, calibrate readings, or perform calculations. This step ensures the accuracy and reliability of the stored data.
4. **Data Storage**: The processed digital data is stored in the data logger's memory, which can be non-volatile flash memory, EEPROM, or an SD card. Non-volatile memory ensures that data is retained even when the logger is powered off.
5. **Time Stamping**: Each data point is typically time-stamped using an internal clock, allowing for precise tracking of when each measurement was taken. This is crucial for analyzing trends and patterns over time.
6. **Data Retrieval**: Stored data can be retrieved via various interfaces such as USB, Bluetooth, Wi-Fi, or cellular connections. Users can download the data to a computer or cloud service for further analysis and reporting.
7. **User Interface**: Some data loggers include a display or interface for real-time monitoring, configuration, and control, allowing users to view data and adjust settings directly on the device.
By following these steps, electrical properties data loggers efficiently capture, store, and manage sensor readings for various applications.
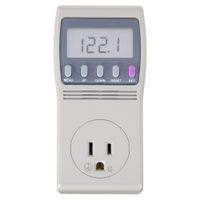
What are the applications of portable KWH recorders?
Portable KWH (kilowatt-hour) recorders are versatile tools used in various applications to measure and analyze electrical energy consumption. Here are some key applications:
1. **Energy Audits**: Portable KWH recorders are essential in conducting energy audits for residential, commercial, and industrial facilities. They help identify energy usage patterns, inefficiencies, and potential areas for energy savings.
2. **Load Studies**: These devices are used to perform load studies by monitoring the power consumption of electrical systems over time. This helps in understanding peak demand periods and optimizing load distribution.
3. **Billing Verification**: They are used to verify utility bills by providing an independent measurement of energy consumption, ensuring that the billed amount matches actual usage.
4. **Equipment Testing**: Portable KWH recorders can be used to test the energy consumption of individual appliances or machinery, helping in assessing their efficiency and operational costs.
5. **Demand Response Programs**: In demand response programs, these recorders help monitor and manage energy usage during peak periods, allowing users to adjust consumption and reduce costs.
6. **Renewable Energy Systems**: They are used to measure the output and efficiency of renewable energy systems like solar panels and wind turbines, ensuring optimal performance and integration with the grid.
7. **Power Quality Analysis**: By recording energy usage, these devices can also help in analyzing power quality issues such as voltage sags, swells, and harmonics, which can affect equipment performance.
8. **Temporary Installations**: For temporary installations or events, portable KWH recorders provide a convenient way to monitor energy usage without the need for permanent metering solutions.
9. **Research and Development**: In R&D, these recorders are used to study energy consumption patterns and develop new energy-efficient technologies and solutions.
10. **Facility Management**: Facility managers use these devices to track energy usage across different areas of a building, enabling better energy management and cost control.
How do recorder sensor kits function with compatible recorders?
Recorder sensor kits function with compatible recorders by utilizing a combination of sensors, data transmission protocols, and recording devices to monitor and log various environmental or physical parameters. These kits typically include sensors that detect specific variables such as temperature, humidity, pressure, motion, or light. Each sensor is designed to convert physical phenomena into electrical signals.
The sensors are connected to a data logger or recorder, which is the central unit responsible for collecting and storing the data. The connection between sensors and recorders can be wired or wireless, depending on the design of the kit. Wired connections often use standard interfaces like USB, I2C, or serial ports, while wireless connections might use Bluetooth, Wi-Fi, or proprietary RF protocols.
Once connected, the sensors continuously or periodically send data to the recorder. The recorder is equipped with a microprocessor that processes incoming signals, converts them into digital data, and stores them in its memory. Some advanced recorders also have the capability to perform real-time data analysis, trigger alarms, or send notifications if certain thresholds are exceeded.
The recorded data can be accessed and analyzed through various means. Many recorders have built-in displays for immediate data viewing, while others require connection to a computer or mobile device for data retrieval. Software applications provided by the manufacturer often facilitate data visualization, analysis, and export.
In summary, recorder sensor kits function by integrating sensors with a compatible recorder to monitor, collect, and store data on specific parameters, enabling users to analyze and respond to environmental or physical changes effectively.
What types of data can flash drives transfer from recorders to computers?
Flash drives can transfer a wide variety of data types from recorders to computers, including:
1. **Audio Files**: These include formats such as MP3, WAV, AAC, and FLAC, which are commonly used for storing recorded audio from voice recorders or music devices.
2. **Video Files**: Formats like MP4, AVI, MOV, and MKV can be transferred, especially if the recorder is a video recording device.
3. **Image Files**: JPEG, PNG, BMP, and TIFF files can be transferred if the recorder captures images or screenshots.
4. **Text Files**: Documents in formats such as TXT, DOC, DOCX, and PDF can be transferred if the recorder supports text data, such as transcription devices.
5. **Data Logs**: CSV, XLS, and other spreadsheet formats can be transferred if the recorder logs data, such as in scientific or industrial applications.
6. **Configuration Files**: These include XML, JSON, or proprietary configuration files that might be used to set up or customize the recorder's settings.
7. **Firmware Updates**: BIN or HEX files can be transferred to update the recorder's firmware.
8. **Executable Files**: In some cases, executable files like EXE or APP might be transferred for software updates or installations related to the recorder.
9. **Compressed Files**: ZIP, RAR, and other compressed formats can be transferred if the data needs to be archived or bundled.
10. **Database Files**: Formats like SQL or MDB can be transferred if the recorder stores data in a database format.
11. **Custom/Proprietary Formats**: Some recorders use proprietary formats that can be transferred and then converted or read by specific software on the computer.
These data types can be easily transferred using a flash drive, making it a versatile tool for moving data between devices.
How do you choose the right data logger for specific measurements?
To choose the right data logger for specific measurements, consider the following factors:
1. **Measurement Type**: Identify the parameters you need to measure, such as temperature, humidity, pressure, voltage, or current. Ensure the data logger supports these measurements.
2. **Accuracy and Resolution**: Determine the required accuracy and resolution for your measurements. Choose a data logger that meets or exceeds these specifications.
3. **Sampling Rate**: Consider the frequency at which data needs to be recorded. Select a data logger with an appropriate sampling rate to capture the necessary detail.
4. **Data Storage Capacity**: Evaluate the amount of data you expect to collect and choose a data logger with sufficient memory to store this data without frequent downloads.
5. **Environmental Conditions**: Assess the environmental conditions where the data logger will be used, such as temperature extremes, humidity, or exposure to water and dust. Choose a logger with suitable environmental protection ratings.
6. **Power Supply**: Consider the power requirements and battery life. For remote or long-term deployments, select a data logger with long battery life or alternative power options like solar.
7. **Connectivity and Data Retrieval**: Determine how you will access the data. Options include USB, Bluetooth, Wi-Fi, or cellular connectivity. Choose a logger that supports your preferred method.
8. **Software and Compatibility**: Ensure the data logger is compatible with your data analysis software and that it offers user-friendly data management tools.
9. **Size and Portability**: Consider the physical size and portability if the logger needs to be moved frequently or used in confined spaces.
10. **Cost**: Balance your budget with the features and specifications required for your application.
11. **Brand Reputation and Support**: Choose a reputable brand known for quality and customer support to ensure reliability and assistance if needed.
What maintenance is required for data recording equipment?
Maintenance of data recording equipment is crucial to ensure accuracy, reliability, and longevity. Key maintenance tasks include:
1. **Regular Calibration**: Ensure the equipment is calibrated according to the manufacturer's specifications to maintain accuracy in data recording.
2. **Software Updates**: Keep the firmware and software up to date to benefit from the latest features, security patches, and bug fixes.
3. **Cleaning**: Regularly clean the equipment to prevent dust and debris from affecting performance. Use appropriate cleaning agents and tools as recommended by the manufacturer.
4. **Inspection**: Conduct routine inspections to check for physical damage, wear and tear, and ensure all components are functioning correctly.
5. **Battery Maintenance**: For portable devices, check battery health and replace batteries as needed to prevent data loss during recording.
6. **Data Backup**: Regularly back up recorded data to prevent loss due to equipment failure or accidental deletion.
7. **Environmental Control**: Ensure the equipment is stored and operated in environments within the specified temperature and humidity ranges to prevent damage.
8. **Connection Checks**: Inspect and maintain all cables and connections to ensure they are secure and free from damage.
9. **Testing**: Periodically test the equipment to verify that it is recording data accurately and reliably.
10. **Documentation**: Maintain detailed records of all maintenance activities, including calibration, repairs, and software updates, to track the equipment's history and performance.
11. **Training**: Ensure that personnel operating the equipment are properly trained in its use and maintenance procedures.
By adhering to these maintenance practices, data recording equipment can function optimally, providing accurate and reliable data over its operational lifespan.
How do you interpret data from circular chart recorders?
To interpret data from circular chart recorders, follow these steps:
1. **Understand the Chart Layout**: Circular chart recorders use a round paper chart that rotates over a set period, typically 24 hours, 7 days, or another specified duration. The chart is divided into concentric circles representing different time intervals, and radial lines indicating measurement values.
2. **Identify the Variables**: Determine what variable the chart is recording, such as temperature, pressure, or humidity. This information is usually labeled on the chart or the recorder itself.
3. **Read the Time Scale**: Locate the time scale, which is usually marked along the outer edge of the chart. Note the starting point and the direction of rotation (usually clockwise). This helps in correlating the data with specific time intervals.
4. **Examine the Measurement Scale**: Identify the measurement scale, often marked with radial lines from the center to the edge. These lines correspond to the range of values the recorder can measure.
5. **Trace the Data Line**: Follow the inked line or trace on the chart, which represents the recorded data over time. The position of this line relative to the measurement scale indicates the value of the variable at any given time.
6. **Analyze Patterns and Trends**: Look for patterns, trends, or anomalies in the data line. Consistent patterns may indicate normal operation, while sudden spikes or drops could suggest issues or changes in the monitored process.
7. **Cross-Reference with Events**: If possible, correlate the data with known events or conditions during the recording period to better understand the context of any anomalies or trends.
8. **Document Findings**: Record your observations and any significant findings for future reference or further analysis.
By systematically examining these elements, you can effectively interpret the data from circular chart recorders.