Call +(254) 703 030 000 / 751 483 999 / 721 704 777
.....Read More
Frequently Asked Questions
What is a circular chart recorder and how does it work?
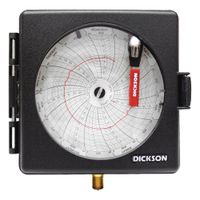
A circular chart recorder is a device used to record data over time on a circular paper chart. It is commonly used in industrial settings to monitor variables such as temperature, pressure, humidity, or flow rates. The device consists of a rotating circular chart, a sensor or probe, and one or more pens that mark the chart.
The chart is mounted on a rotating disc, which typically completes one full rotation over a set period, such as 24 hours, 7 days, or even a month, depending on the application. The sensor detects the variable being measured and sends a signal to the pen mechanism. The pen, which is in contact with the chart, moves radially in response to the sensor's input, marking the chart with a continuous line that represents the variable's value over time.
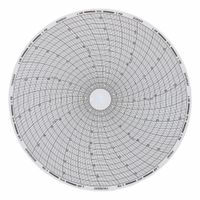
The chart is divided into concentric circles, each representing a different value range, and is often pre-printed with time and value scales. As the chart rotates, the pen traces a path that provides a visual representation of the data, allowing operators to easily identify trends, fluctuations, and anomalies.
Circular chart recorders are valued for their simplicity, reliability, and ability to provide a permanent, hard-copy record of data. They are particularly useful in environments where digital data logging is impractical or where a visual, real-time display of data is required. Despite the rise of digital data loggers, circular chart recorders remain in use due to their straightforward operation and ease of interpretation.
What types of sensors are compatible with circular chart recorders?
Circular chart recorders are compatible with various types of sensors, each designed to measure specific parameters. Common sensor types include:
1. **Thermocouples**: These sensors measure temperature by generating a voltage based on the temperature difference between two dissimilar metals. They are widely used due to their broad temperature range and fast response time.
2. **RTDs (Resistance Temperature Detectors)**: RTDs measure temperature by correlating the resistance of the RTD element with temperature. They offer high accuracy and stability, making them suitable for precise temperature monitoring.
3. **Thermistors**: These are temperature-sensitive resistors that change resistance with temperature changes. They are highly sensitive and suitable for applications requiring precise temperature control over a limited range.
4. **Pressure Transducers**: These sensors convert pressure into an electrical signal. They are used in applications where monitoring of gas or liquid pressure is required.
5. **Flow Sensors**: These sensors measure the flow rate of liquids or gases. They are essential in processes where maintaining a specific flow rate is critical.
6. **pH Sensors**: Used to measure the acidity or alkalinity of a solution, pH sensors are crucial in chemical processing and water treatment applications.
7. **Humidity Sensors**: These sensors measure the moisture content in the air. They are used in environments where humidity control is necessary, such as HVAC systems and storage facilities.
8. **Level Sensors**: These sensors detect the level of liquids or solids within a container. They are used in industries like food and beverage, pharmaceuticals, and water treatment.
Circular chart recorders can be configured to work with these sensors by selecting the appropriate input type and calibration settings, ensuring accurate data recording and monitoring.
How do you install and replace chart paper in a circular chart recorder?
1. **Turn Off the Recorder**: Ensure the chart recorder is powered off to prevent any accidental data recording or damage.
2. **Open the Recorder**: Unlock and open the front cover or panel of the chart recorder to access the chart paper area.
3. **Remove the Old Chart Paper**: Carefully lift or slide out the used chart paper from the spindle or pins. Note the orientation and positioning for reference.
4. **Select the Correct Chart Paper**: Ensure you have the correct type and size of chart paper that matches the recorder’s specifications and the recording period (e.g., 24-hour, 7-day).
5. **Install the New Chart Paper**:
- **Align the Paper**: Place the new chart paper onto the spindle or pins, aligning it with the reference marks or guides.
- **Secure the Paper**: Ensure the paper is flat and properly secured. Some models may require you to lock the paper in place using clips or a central hub.
6. **Set the Time and Date**: Adjust the chart paper to the correct starting time and date. This may involve manually rotating the paper or using a time-setting mechanism.
7. **Check the Pen Alignment**: Ensure the recording pen or stylus is correctly aligned with the starting point on the chart paper. Adjust if necessary.
8. **Close the Recorder**: Securely close and lock the front cover or panel.
9. **Power On the Recorder**: Turn the recorder back on and verify that it is functioning correctly, with the pen marking accurately on the chart paper.
10. **Monitor Initial Operation**: Observe the first few cycles to ensure the chart paper is advancing correctly and the pen is recording data accurately.
What are the common applications for circular chart recorders?
Circular chart recorders are widely used in various industries for monitoring and recording data over time. Common applications include:
1. **Temperature Monitoring**: In industries like food processing, pharmaceuticals, and HVAC systems, circular chart recorders track temperature changes to ensure compliance with safety and quality standards.
2. **Pressure Recording**: Used in oil and gas, chemical processing, and water treatment plants to monitor pressure levels in pipelines and vessels, ensuring system integrity and safety.
3. **Humidity Tracking**: In environments where humidity control is crucial, such as greenhouses, storage facilities, and museums, these recorders help maintain optimal conditions.
4. **Flow Measurement**: In water treatment and distribution, circular chart recorders measure and record the flow rates of liquids and gases, aiding in process control and leak detection.
5. **pH Level Monitoring**: In chemical manufacturing and wastewater treatment, they track pH levels to ensure processes remain within desired parameters.
6. **Refrigeration Systems**: Used in cold storage and transportation, they monitor temperature fluctuations to prevent spoilage of perishable goods.
7. **Environmental Monitoring**: In laboratories and research facilities, they record environmental conditions to ensure accurate experimental results.
8. **Industrial Processes**: In manufacturing, they monitor various parameters like temperature, pressure, and flow to optimize production efficiency and maintain product quality.
9. **Power Generation**: In power plants, they track parameters like steam pressure and temperature to ensure efficient and safe operation.
10. **Compliance and Auditing**: Circular chart recorders provide a physical record of data, useful for audits and regulatory compliance in industries like pharmaceuticals and food production.
These devices are valued for their reliability, simplicity, and ability to provide a continuous, visual record of data over time, making them essential tools in many industrial and commercial applications.
How do you maintain and calibrate a circular chart recorder?
To maintain and calibrate a circular chart recorder, follow these steps:
1. **Regular Inspection**: Check the recorder for physical damage, wear, or dirt. Ensure the chart paper is correctly installed and the pen is functioning.
2. **Cleaning**: Clean the recorder regularly. Use a soft, lint-free cloth to wipe the exterior and interior components. Avoid using harsh chemicals that could damage the device.
3. **Chart Paper Replacement**: Replace the chart paper as needed. Ensure it is properly aligned and secured to prevent inaccurate readings.
4. **Pen Maintenance**: Check the pen for ink levels and replace or refill as necessary. Ensure the pen is not clogged and moves freely.
5. **Calibration**:
- **Preparation**: Turn off the recorder and remove the chart paper.
- **Reference Standard**: Use a calibrated reference instrument to provide a known input signal.
- **Adjustment**: Compare the recorder's output with the reference standard. Adjust the zero and span settings to match the reference.
- **Verification**: Recheck the calibration at multiple points across the range to ensure accuracy.
- **Documentation**: Record the calibration results, including date, time, and any adjustments made.
6. **Functional Testing**: After calibration, perform a functional test to ensure the recorder operates correctly. Check for smooth pen movement and accurate timekeeping.
7. **Scheduled Maintenance**: Establish a regular maintenance schedule based on the manufacturer's recommendations and the recorder's usage conditions.
8. **Training**: Ensure personnel are trained in proper maintenance and calibration procedures to prevent errors.
9. **Record Keeping**: Maintain detailed records of all maintenance and calibration activities for future reference and compliance with industry standards.
By following these steps, you can ensure the circular chart recorder remains accurate and reliable.
What are the differences between circular chart recorders and digital data loggers?
Circular chart recorders and digital data loggers are both used for recording data over time, but they differ in several key aspects:
1. **Data Recording Method**:
- Circular Chart Recorders: Use a rotating paper chart and a pen to record data. The chart is typically circular, and the pen moves in response to the measured variable, creating a visual record.
- Digital Data Loggers: Use electronic sensors and digital storage to record data. Data is stored in a digital format, often on internal memory or removable media.
2. **Data Accessibility**:
- Circular Chart Recorders: Data is immediately visible on the chart but requires manual interpretation and archiving.
- Digital Data Loggers: Data can be accessed via software, allowing for easy analysis, sharing, and long-term storage.
3. **Accuracy and Precision**:
- Circular Chart Recorders: Generally less precise due to mechanical limitations and potential for human error in reading charts.
- Digital Data Loggers: Typically offer higher accuracy and precision, with the ability to record data at high resolutions.
4. **Data Capacity**:
- Circular Chart Recorders: Limited by the size of the chart, usually requiring frequent replacement.
- Digital Data Loggers: Can store large amounts of data over extended periods, depending on memory capacity.
5. **Versatility**:
- Circular Chart Recorders: Limited to specific applications and environments.
- Digital Data Loggers: Highly versatile, capable of recording multiple parameters simultaneously and adaptable to various applications.
6. **Maintenance**:
- Circular Chart Recorders: Require regular maintenance, including chart and pen replacement.
- Digital Data Loggers: Generally low maintenance, with occasional calibration and battery replacement.
7. **Cost**:
- Circular Chart Recorders: Often less expensive initially but may incur higher long-term costs due to consumables.
- Digital Data Loggers: Higher initial cost but more cost-effective over time due to reduced consumable needs.
How do you choose the right circular chart recorder for your needs?
To choose the right circular chart recorder, consider the following factors:
1. **Measurement Parameters**: Determine what you need to measure (e.g., temperature, pressure, humidity) and ensure the recorder supports these parameters.
2. **Range and Accuracy**: Check the measurement range and accuracy to ensure they meet your specific requirements.
3. **Chart Size and Duration**: Decide on the chart size (e.g., 6-inch, 12-inch) and the recording duration (e.g., 24-hour, 7-day) based on how frequently you need to review data.
4. **Number of Pens**: Consider how many variables you need to record simultaneously. Multi-pen recorders can track multiple parameters.
5. **Environment**: Assess the operating environment. Choose a recorder with appropriate protection (e.g., weatherproof, explosion-proof) for harsh conditions.
6. **Power Source**: Determine if you need a battery-operated or AC-powered recorder based on the availability of power sources at the installation site.
7. **Data Output**: Decide if you need digital data output for integration with other systems or if analog output suffices.
8. **Ease of Use**: Look for user-friendly features such as easy chart replacement, clear displays, and simple calibration procedures.
9. **Brand and Support**: Choose a reputable brand known for reliability and ensure they offer good customer support and service.
10. **Cost**: Balance your budget with the features you need. Consider long-term costs, including maintenance and consumables like charts and pens.
11. **Compliance and Standards**: Ensure the recorder complies with industry standards and regulations relevant to your application.
By evaluating these factors, you can select a circular chart recorder that best fits your operational needs and ensures accurate and reliable data recording.