Call +(254) 703 030 000 / 751 483 999 / 721 704 777
.....Read More
Frequently Asked Questions
How do strip chart temperature recorders work?
Strip chart temperature recorders work by continuously recording temperature data on a moving strip of paper. The device consists of several key components: a temperature sensor, a recording mechanism, and a motor-driven paper feed.
1. **Temperature Sensor**: The sensor, often a thermocouple, thermistor, or RTD (Resistance Temperature Detector), detects temperature changes in the environment. It converts these changes into an electrical signal proportional to the temperature.
2. **Recording Mechanism**: The electrical signal from the sensor is sent to a pen or stylus mechanism. This mechanism translates the signal into a physical movement. The pen is mounted on an arm that moves up and down across the width of the paper strip, corresponding to the temperature changes.
3. **Paper Feed**: The strip of paper is mounted on a drum or spool and is moved at a constant speed by a motor. The speed can often be adjusted to suit the desired recording interval, ranging from minutes to days. As the paper moves, the pen traces a continuous line, creating a graph of temperature over time.
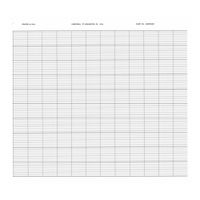
4. **Calibration and Scale**: The recorder is calibrated to ensure accuracy. The paper is usually pre-printed with a grid or scale, allowing for easy reading of temperature values. The scale is matched to the range of temperatures being measured.
5. **Power Source**: The device is powered by electricity, either from a mains supply or batteries, to drive the motor and recording mechanism.
Strip chart recorders are valued for their simplicity and ability to provide a permanent, visual record of temperature data, useful for monitoring and analysis in various industrial, laboratory, and environmental applications.
What are the benefits of using strip chart temperature recorders?
Strip chart temperature recorders offer several benefits:
1. **Continuous Monitoring**: They provide a continuous, real-time record of temperature changes over time, which is crucial for processes requiring constant temperature control.
2. **Historical Data**: The physical chart provides a historical record that can be archived for future reference, audits, or compliance with regulatory requirements.
3. **Simplicity and Reliability**: These devices are straightforward to use and maintain, with a mechanical design that is less prone to digital failures, making them reliable in various environments.
4. **Visual Representation**: The strip chart offers an immediate visual representation of temperature trends, making it easy to identify patterns, anomalies, or deviations from set parameters.
5. **No Power Dependency**: Many strip chart recorders can operate without a continuous power supply, using battery backup, which ensures data recording even during power outages.
6. **Durability**: They are often robust and can function in harsh conditions where digital devices might fail, such as in high humidity or dusty environments.
7. **Cost-Effective**: Generally, strip chart recorders are more affordable than digital systems, both in terms of initial investment and maintenance costs.
8. **Ease of Use**: They do not require complex software or technical expertise to operate, making them accessible to a wide range of users.
9. **Immediate Access**: Data is immediately available on the chart, without the need for downloading or processing, which can be crucial in time-sensitive situations.
10. **Versatility**: They can be used in various industries, including pharmaceuticals, food processing, and HVAC systems, to ensure compliance with temperature regulations.
These benefits make strip chart temperature recorders a valuable tool for many applications requiring reliable and straightforward temperature monitoring.
How do you load paper into a strip chart recorder?
1. **Turn Off the Recorder**: Ensure the strip chart recorder is turned off to prevent any accidental damage or data loss.
2. **Open the Paper Compartment**: Locate and open the paper compartment or door. This is usually at the back or top of the recorder.
3. **Remove Old Paper**: If there is any old paper, carefully remove it by pulling it out of the feed mechanism. Dispose of it properly.
4. **Prepare New Paper Roll**: Take the new roll of chart paper and remove any packaging. Ensure the paper is the correct size and type for your recorder.
5. **Position the Paper Roll**: Place the new paper roll onto the designated spindle or holder. Ensure it is positioned so that the paper feeds from the bottom of the roll.
6. **Thread the Paper**: Pull the leading edge of the paper and thread it through the paper path. This usually involves feeding it under a roller or through a guide. Follow any arrows or guides printed on the recorder.
7. **Align the Paper**: Make sure the paper is aligned properly and not skewed. It should be straight and centered to avoid jams or misprints.
8. **Secure the Paper**: If your recorder has a clamping mechanism, use it to secure the paper in place. This might involve closing a latch or pressing a button to lock the paper.
9. **Close the Compartment**: Once the paper is properly loaded and secured, close the paper compartment or door.
10. **Test the Feed**: Turn on the recorder and perform a test feed to ensure the paper advances correctly without jamming or misaligning.
11. **Adjust Settings**: If necessary, adjust the chart speed or other settings to match your recording requirements.
What types of sensors are compatible with strip chart recorders?
Strip chart recorders are compatible with a variety of sensors, each designed to measure different types of physical phenomena. Common sensor types include:
1. **Thermocouples**: Used for temperature measurement, thermocouples generate a voltage proportional to temperature differences. They are widely used due to their broad temperature range and fast response time.
2. **RTDs (Resistance Temperature Detectors)**: Also for temperature measurement, RTDs offer high accuracy and stability. They work by changing resistance with temperature changes.
3. **Thermistors**: Another temperature sensor, thermistors are highly sensitive and suitable for precise temperature measurements over a limited range.
4. **Pressure Transducers**: These sensors convert pressure into an electrical signal. They are used in applications requiring pressure monitoring, such as in fluid systems.
5. **Load Cells**: Used for measuring force or weight, load cells convert a force into an electrical signal. They are essential in industrial weighing applications.
6. **pH Sensors**: These measure the acidity or alkalinity of a solution. They are crucial in chemical processing and water treatment applications.
7. **Flow Sensors**: Used to measure the flow rate of liquids or gases, these sensors are vital in process control and monitoring systems.
8. **Humidity Sensors**: These measure the moisture content in the air and are used in environmental monitoring and HVAC systems.
9. **Voltage and Current Sensors**: These sensors measure electrical parameters and are used in electrical and electronic applications for monitoring and control.
10. **Displacement Sensors**: Used to measure linear or angular displacement, these sensors are important in mechanical and structural applications.
Strip chart recorders can be configured to work with these sensors by using appropriate signal conditioning and input modules, allowing them to record and display data in real-time.
How do you calibrate a strip chart temperature recorder?
To calibrate a strip chart temperature recorder, follow these steps:
1. **Preparation**: Ensure the recorder is clean and in good working condition. Gather necessary tools, including a calibrated reference thermometer, calibration bath or dry block calibrator, and any required documentation.
2. **Stabilize Environment**: Place the recorder in a stable environment to avoid temperature fluctuations during calibration.
3. **Set Up Reference**: Use a calibration bath or dry block calibrator to provide a stable temperature source. Insert the reference thermometer and the recorder's temperature sensor into the bath or block.
4. **Initial Check**: Power on the recorder and allow it to warm up as per the manufacturer's instructions. Verify that the chart paper is correctly installed and the pen is functioning.
5. **Calibration Points**: Select at least three calibration points across the recorder's operating range (e.g., low, mid, and high points).
6. **Adjust Temperature**: Set the calibration bath or dry block to the first calibration point. Allow the system to stabilize.
7. **Record Readings**: Once stable, compare the recorder's reading with the reference thermometer. Note any discrepancies.
8. **Adjust Recorder**: If discrepancies exist, adjust the recorder's calibration settings according to the manufacturer's instructions to match the reference thermometer.
9. **Repeat**: Repeat the process for the remaining calibration points, adjusting as necessary.
10. **Verification**: After adjustments, recheck all calibration points to ensure accuracy across the range.
11. **Documentation**: Record all calibration data, including date, time, reference readings, recorder readings, and any adjustments made.
12. **Final Check**: Ensure the recorder is functioning correctly and the chart paper is advancing properly.
13. **Seal and Label**: If required, seal the calibration settings and label the recorder with the calibration date and due date for the next calibration.
14. **Restore Setup**: Return the recorder to its operational setup and ensure it is ready for use.
What are common troubleshooting tips for strip chart recorders?
1. **Check Power Supply**: Ensure the strip chart recorder is properly connected to a power source. Verify that the power switch is on and check for any blown fuses or tripped circuit breakers.
2. **Inspect Connections**: Examine all electrical connections, including input and output terminals, for loose or corroded contacts. Tighten any loose connections and clean any corrosion.
3. **Verify Input Signals**: Confirm that the input signals are within the specified range of the recorder. Use a multimeter to check the signal levels and ensure they match the expected values.
4. **Examine Chart Paper and Pens**: Ensure the chart paper is correctly loaded and not jammed. Check that the pens or styluses are in good condition, properly aligned, and have sufficient ink. Replace any worn or dried-out pens.
5. **Calibrate the Recorder**: Perform a calibration check to ensure the recorder is accurately capturing data. Follow the manufacturer's instructions for calibration procedures.
6. **Check for Mechanical Issues**: Inspect the drive mechanism for any obstructions or wear. Ensure that gears, belts, and motors are functioning smoothly without unusual noises or resistance.
7. **Review Settings and Configuration**: Verify that the recorder's settings, such as chart speed, time, and date, are correctly configured. Adjust any incorrect settings according to the operational requirements.
8. **Test for Environmental Factors**: Ensure the recorder is operating in a suitable environment, free from excessive dust, moisture, or temperature extremes that could affect performance.
9. **Consult the Manual**: Refer to the user manual for specific troubleshooting steps and error codes related to your model. Follow the recommended procedures for resolving identified issues.
10. **Seek Professional Assistance**: If the problem persists after performing basic troubleshooting, contact the manufacturer or a qualified technician for further diagnosis and repair.
How do you interpret the data from a strip chart temperature recorder?
A strip chart temperature recorder continuously records temperature data over time on a paper strip. To interpret the data:
1. **Understand the Scale**: Identify the temperature scale (Celsius or Fahrenheit) and the time scale (minutes, hours, days) on the chart. This helps in accurately reading the temperature values and understanding the time intervals.
2. **Identify Baseline**: Determine the baseline or starting point of the recording. This is crucial for comparing changes over time.
3. **Analyze Trends**: Look for patterns or trends in the data. A rising line indicates increasing temperatures, while a falling line suggests decreasing temperatures. Consistent horizontal lines suggest stable temperatures.
4. **Spot Anomalies**: Identify any sudden spikes or drops, which may indicate anomalies or errors in the system. These could be due to environmental changes, equipment malfunction, or data recording errors.
5. **Compare with Standards**: Compare the recorded data against expected temperature ranges or standards for the specific application. This helps in assessing whether the system is operating within acceptable limits.
6. **Note Cycles**: Observe any cyclical patterns, which might indicate regular environmental changes or system operations, such as day-night temperature variations.
7. **Check for Gaps**: Look for any gaps or irregularities in the recording, which might suggest issues with the recorder or interruptions in data collection.
8. **Document Observations**: Record your observations, noting any significant patterns, anomalies, or deviations from expected values. This documentation is essential for troubleshooting and future reference.
9. **Correlate with Events**: If possible, correlate temperature changes with specific events or conditions to understand causality.
10. **Review Regularly**: Regularly review and analyze the data to ensure ongoing system performance and to preemptively address potential issues.